
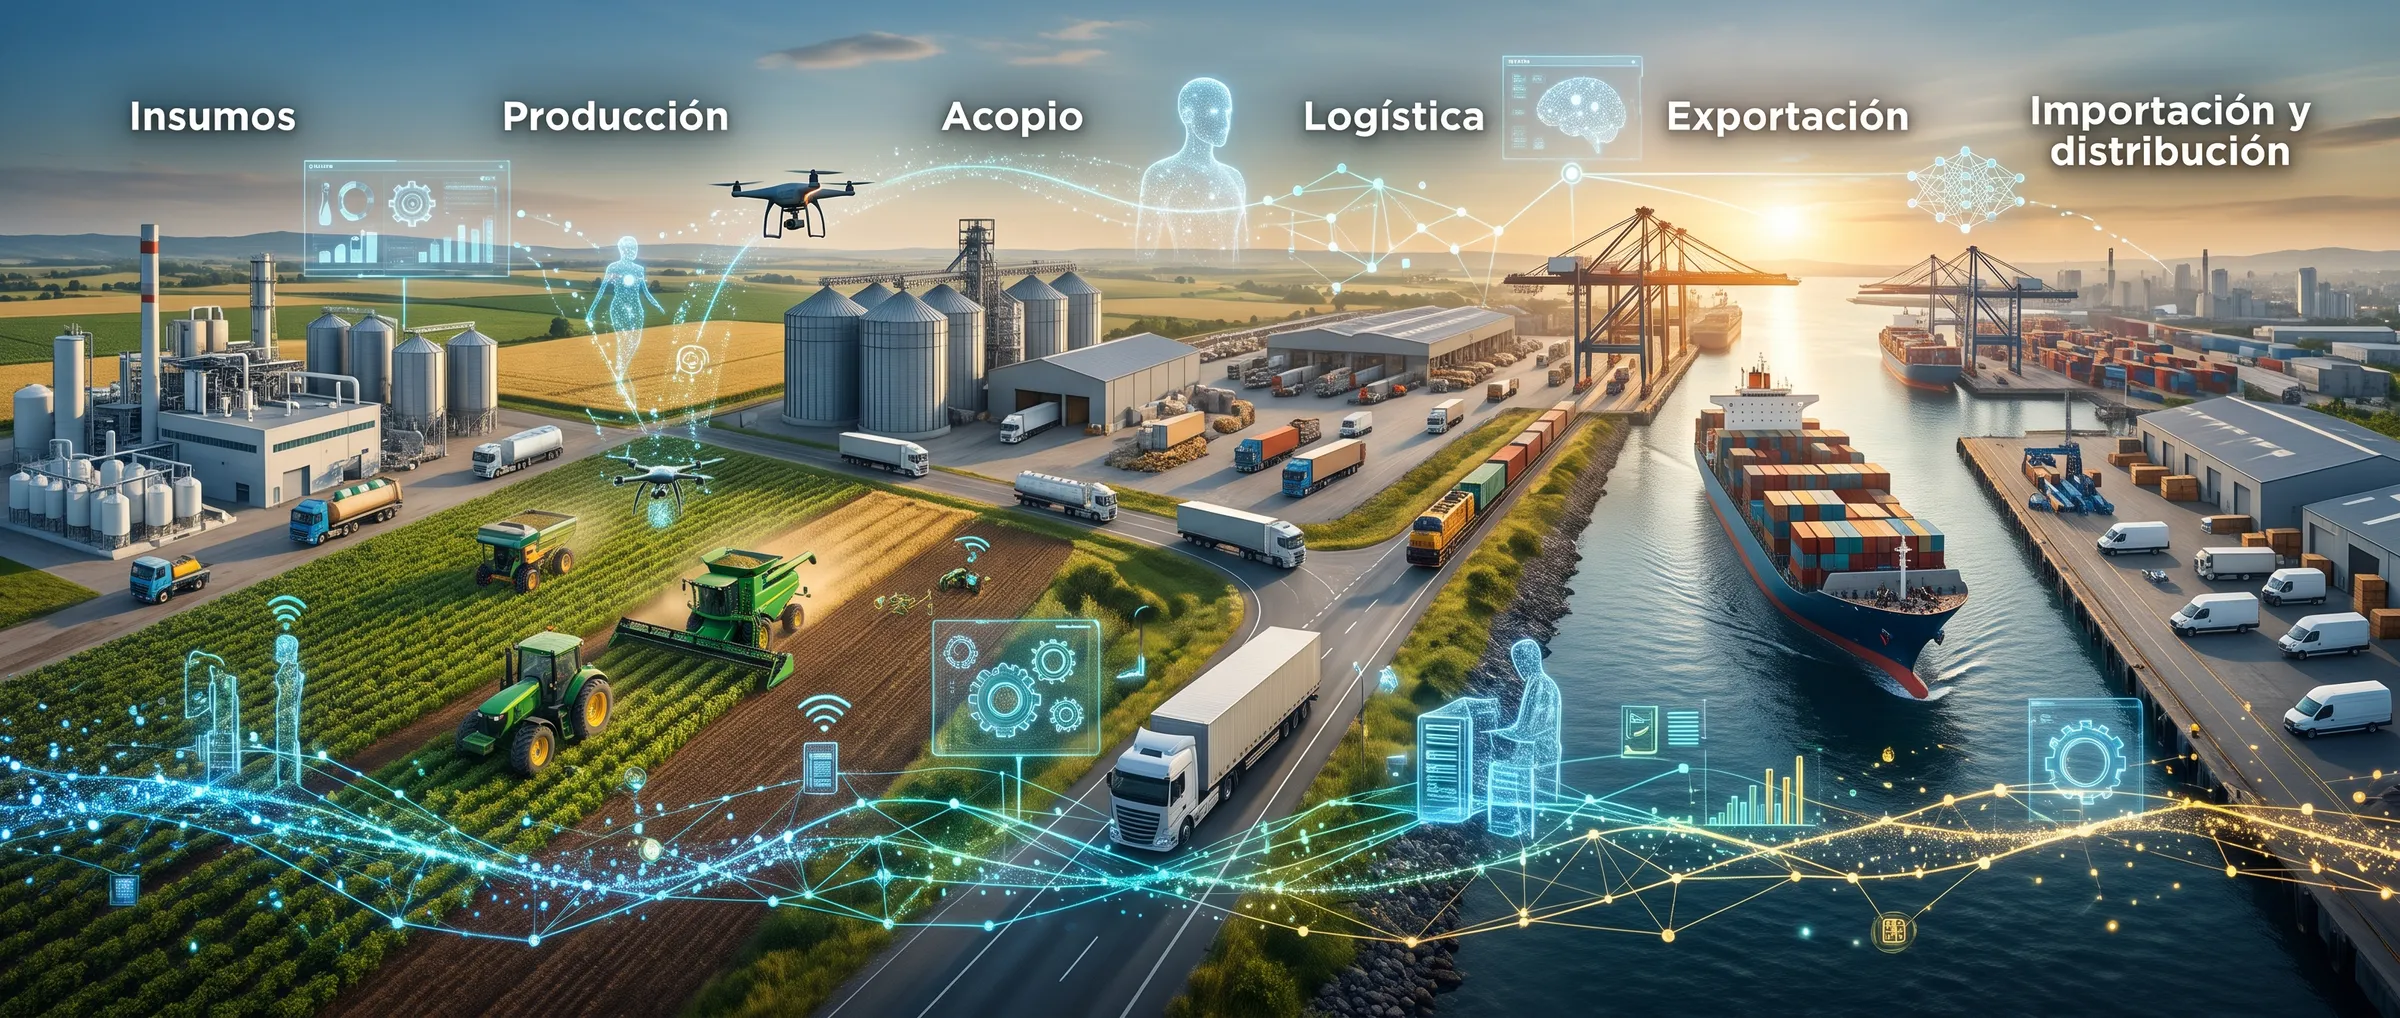
The entire value chain, in a single model
Grains and agriculture
From field to settlement, with the numbers tied together.
More about Grains and agriculture →How is wheat yield trending compared to the previous season?
Livestock
Stock, health, and movements, without parallel spreadsheets.
More about Livestock →How much stock do I have by category and by establishment?
Exporters
Shipment compliance, visible before it becomes a problem.
More about Exporters →How is the month's shipping compliance tracking?
Machinery
Fleet telemetry, cross-referenced with what it cost.
More about Machinery →How many effective hours did each machine work?
Logistics
Every weigh-in, every trip, and every delay in the same place.
More about Logistics →Where are the truck weighings?
Genetics
Trace performance back to the source.
More about Genetics →How did each genetic line perform?
Fishing and aquaculture
From vessel or cage to report, with no manual re-entry.
More about Fishing and aquaculture →How is feed conversion coming along by cage?
Forestry
Inventory and growth over long cycles.
More about Forestry →How did inventory by stand evolve?
Isn't your link in the list?
Tell us what you measure and what systems you use: the canonical model covers thirteen domains of the value chain.